Coal Plant Emissions and Environmental Impacts in the Indo-Gangetic Plain (IGP)
Project Information
- Category: Data visualization
- Client: APAD
- Project Date: 17 August, 2024
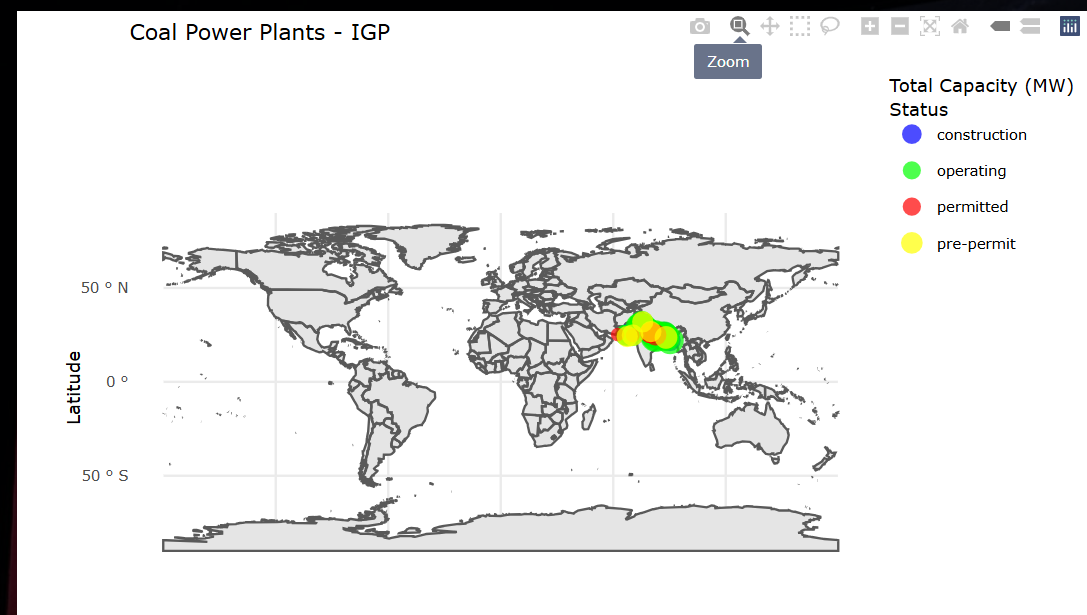
This project demonstrates a data visualization model for the Coal plants in the (IGP) using Plotly, created with R. The visualization provides a detailed representation of the Coal IGP and offers insights into the underlying data through interactive charts.
Project Overview
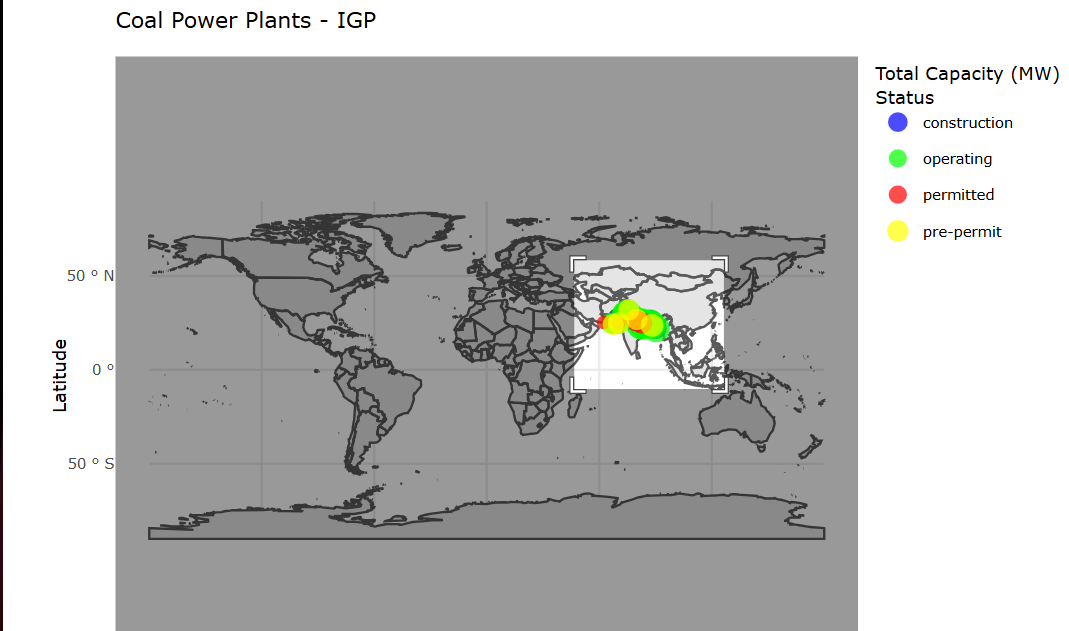
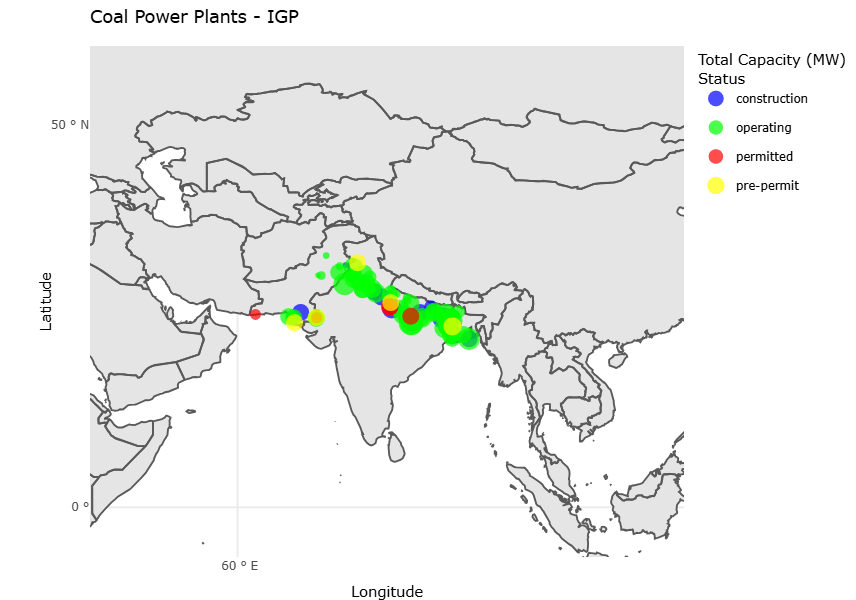
This visualization provides an in-depth look at coal plants in the Indo-Gangetic Plain (IGP) region, focusing on their spatial distribution, emissions, and proximity to population centers. The interactive dashboard integrates geographic data with environmental indicators, offering stakeholders the ability to explore trends and patterns critical to understanding the ecological and social impacts of coal plant operations. Designed for intuitive navigation, this tool empowers users with actionable insights for policy-making and environmental management.
To navigate the HTML page, use the interactive thumbnails on the main screen to access different sections of the visualization. Each thumbnail links to a detailed view of the data, allowing for easy exploration and understanding of the Coal plants in the IGP region. Simply click on the desired section to interact with the corresponding charts and data.